Hormuz now sets the price of money
Three members of the Federal Open Market Committee voted for a rate hike on July 29. In the very same week, US annual inflation computed on the EPTA5 base fell from +4.17% to +3.46%, a 70 basis point drop in one month, almost entirely driven by energy. Both camps are looking at the same barrel of oil and drawing opposite conclusions. This note walks through the split, what the bond market has already decided, and the one number that does not fit. Every figure below carries a status in the verification register at the end.
1. What happened
On July 29 the FOMC held the federal funds target in the 3.50% to 3.75% range for a fifth consecutive meeting. The vote was carried 9 to 3: Beth Hammack, Neel Kashkari and Lorie Logan all dissented in favour of a quarter point increase [1]. That detail is not cosmetic. Press coverage points out you have to go back to September 2016 to find three dissents pointing in the same direction, and it is the first visible fracture of Kevin Warsh's tenure, who took office on May 22, 2026, replacing Jerome Powell [2].
The effective rate printed 3.63% on July 31 in the EPTA5 base, exactly the middle of the range: no technical stress in the money market, the Federal Reserve controls the rate it targets.
2. Why the barrel commands everything
The macro story of 2026 fits in a single curve. Between February and April, WTI went from a monthly low of $61.60 to a monthly high of $114.58, a 71% surge in eight weeks, on the closure of the Strait of Hormuz and the blockade of Saudi ports in the Red Sea. The move then reversed just as brutally. On August 3, WTI traded at $79.77, down 5.9%, after Donald Trump announced he had called off a new round of strikes on Iran; Brent slipped 5.1% to $83.47. In July alone, both benchmarks had gained more than 20% [4][5].
That trajectory reads directly into consumer prices, with the one month lag you expect from an energy shock. Monthly inflation accelerated to +0.87% in March, its highest in two years, stayed elevated through April and May, then turned negative in June at minus 0.42%. Year on year, the pullback runs from +4.17% in May to +3.46% in June.
3. The bond market has already picked a side
The July 29 hold was read as a status quo. The curve tells another story. The spread between the ten year and the two year moved from +31 basis points on July 1 to +47 on July 31, while the ten year yield did not move at all, anchored at 4.47%. Arithmetically that means one thing only: the two year lost 16 basis points in a month. While three governors argued for a hike, the bond market was buying the short end, which is to say it was pricing cuts.
The rest of the dashboard validates that camp. The VIX is back to 17.09. The St. Louis Fed financial stress index sits at minus 0.83, its lowest of the observed period. High yield spreads hold at 2.84%, virtually unchanged this year despite a 71% oil shock: no sign of contagion into credit.
| Indicator | Jul 31 | 1 week | 1 month | Dec 31, 25 |
|---|---|---|---|---|
| Fed funds, effective | 3.63% | 3.63% | 3.63% | 3.72% |
| 10 year yield | 4.47% | 4.47% | 4.47% | 4.14% |
| 10y minus 2y slope | +47 bp | +36 bp | +31 bp | +71 bp |
| Unemployment | 4.2% | 4.2% | 4.2% | 4.4% |
| Weekly jobless claims | 197,000 | 188,000 | 217,000 | 203,000 |
| VIX | 17.09 | 18.58 | 16.59 | 14.95 |
| WTI crude | $84.25 | $91.74 | $69.74 | $57.26 |
| High yield spread | 2.84% | 2.79% | 2.74% | 2.81% |
| Financial stress index | -0.83 | -0.83 | -0.64 | -0.57 |
| Consumer sentiment | 49.5 | 49.5 | 49.5 | 52.9 |
| Euro area 10 year | 3.22% | 3.22% | 3.22% | 3.24% |
4. The fault line
One number does not fit the rest: consumer sentiment at 49.5. Financial markets show historically low stress, unemployment is down to 4.2%, weekly claims run at 197,000, and American households still sit at a level of morale usually associated with recessions. It is the classic gap between the price of gasoline and the price of assets: a household that watched the barrel double between February and April does not forget it because the VIX went back to 17.
That gap is the real risk of the second half. If the Hormuz detente holds, it closes, and the rate cut camp wins the argument. If the closure resumes, inflation reignites and the three dissenters were right. The next scheduled central bank test is the Bank of England decision on 17 September; the Bank held its rate at 3.75% on 30 July, its fifth consecutive hold of 2026[7].
5. What the terminal adds, and what it does not show
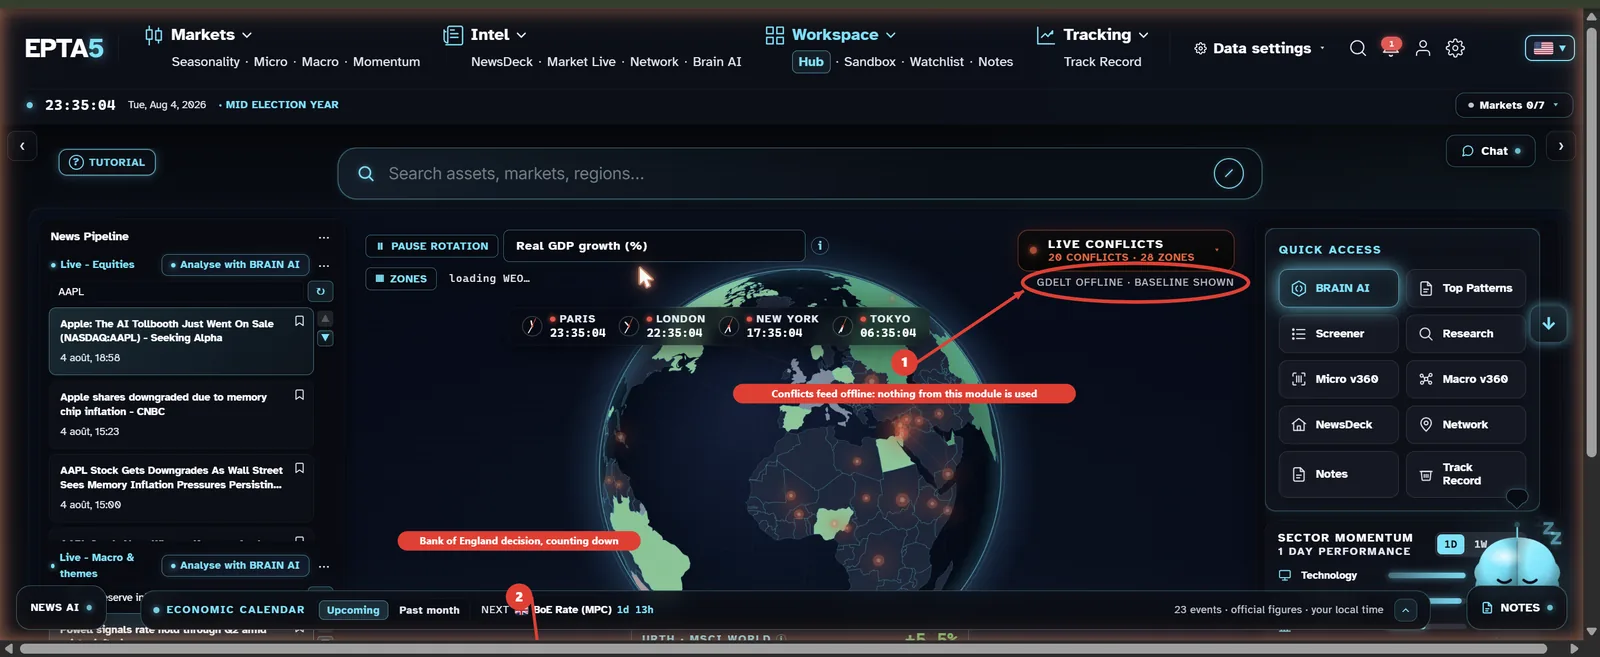
This note is produced inside the EPTA5 terminal, and transparency about the tool is part of the method, including when the tool is wrong. The Hub provides the globe, which recolours every country by the selected indicator, and the continuous news pipeline, every usable item of which was re-verified at the primary source before entering this note. The armed conflicts module provides the method lesson of the week. On August 3, at the time of the analysis, it displayed the notice GDELT OFFLINE, BASELINE SHOWN: feed down, static reference map, so none of its data was used, and the capture below shows the terminal stating it plainly.
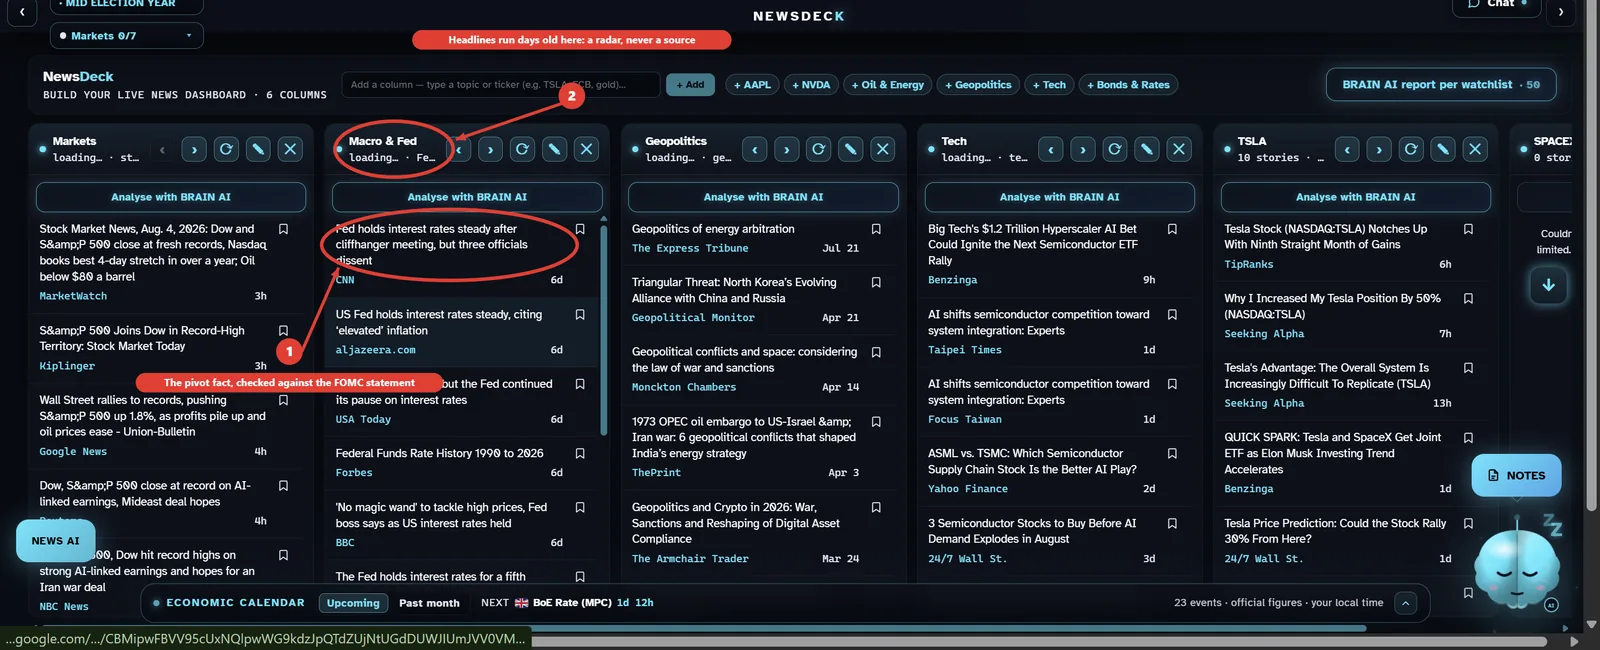
The economic calendar, on the other hand, failed silently, and we published its error before catching it. It counted down to a Bank of England decision in the first week of August. There is no such meeting: the Bank's 2026 calendar runs 5 February, 19 March, 30 April, 18 June, 30 July, 17 September, 5 November, 17 December[7]. An earlier version of this note carried that date. It has been corrected, and the episode makes the point better than the original paragraph did: a countdown looks like data, which is exactly what makes an unverified calendar dangerous. Read the state of the sensor before reading the measure, date every capture, and check the schedule against the institution that publishes it.
The following items circulated in the press flow this week. None is confirmed by a primary source, none enters the reasoning above. A Tesla and SpaceX merger, reported by five articles in forty eight hours, always conditional, with no filing and no company statement, and a retail buyout scenario near $450. A Chinese spin off of Tesla, presented as preparatory to that merger, same status, publicly denied by the chief executive. And a near $700 billion drop in Elon Musk's personal fortune, an implausible absolute figure published without methodology, discarded.
| Claim | Origin | Status |
|---|---|---|
| Rates held at 3.50 to 3.75%, 9 to 3 vote, three hawkish dissents | FOMC statement, July 29 [1] | Primary source |
| Kevin Warsh chairs the Federal Reserve since May 22, 2026 | Board of Governors release [2] | Primary source |
| Annual inflation from +4.17% to +3.46% between May and June | Series us_inflation_cpi, EPTA5 base | Internal computation |
| WTI from $61.60 to $114.58 between February and April | Series world_oil_wti, EPTA5 base | Internal computation |
| WTI $79.77 and Brent $83.47 on August 3 | Four independent first rank outlets [4][5][6] | Cross checked press |
| The two year lost 16 basis points in July | Slope and constant ten year, EPTA5 base | Deduction |
| Tesla and SpaceX merger, China spin off, Musk fortune | No primary source | Discarded |
Sources
- [1] Federal Reserve Board, FOMC statement, July 29, 2026. federalreserve.gov
- [2] Federal Reserve Board, Kevin Warsh takes the oath of office, May 22, 2026. federalreserve.gov
- [3] CNBC, Divided Fed holds interest rates steady, July 29, 2026. cnbc.com
- [4] The Washington Post, Oil prices drop after Trump orders US forces to hold off on new strikes against Iran, August 2, 2026. washingtonpost.com
- [5] CNBC, Trump says he called off planned strike on Iran, August 3, 2026. cnbc.com
- [7] Bank of England, Monetary Policy Committee dates for 2026, and Monetary Policy Summary of 30 July 2026 (Bank Rate maintained at 3.75%). bankofengland.co.uk
- [6] NBC News, Oil prices slide as U.S. and Iran pause strikes, August 3, 2026. nbcnews.com
Method. Internal data: EPTA5 macro base, table macro_master_wide, 48 daily series, last observation July 31, 2026; inflation and oil statistics recomputed from the raw series. Every external fact was verified at the primary source or cross checked across several first rank outlets, then submitted to an independent adversarial re-check; aggregators and content farms are excluded from sourcing. The annotated terminal screenshots supporting this note are archived on the French desk edition.
Disclaimer. This article is published for educational and informational purposes only. It does not constitute investment advice within the meaning of MiFID II, nor an investment recommendation within the meaning of Regulation (EU) 596/2014, nor an inducement to buy or sell any financial instrument. Nothing here accounts for the situation, objectives or horizon of any particular reader. Past performance is not a reliable indicator of future performance. EPTA5 INC. is a data and software platform; we provide tools and historical series, not portfolio management.
Discussion(0)