NVIDIA, the year the results caught up with the price
Profits up 85 percent. The share, up 8.
On May 20, NVIDIA reported a first quarter of fiscal 2027 at 81.6 billion dollars of revenue, up 85 percent on the year, of which 75.2 billion came from data centres, with a GAAP gross margin of 74.9 percent and an operating result of 53.5 billion, 65.6 percent of revenue by our calculation on the SEC release [1]. Guidance for the second quarter points to 91 billion, and the company states it assumes no China compute revenue at all in that number. Twenty billion went back to shareholders in the quarter and the buyback authorisation grew by eighty billion.
The share price tells a quieter story. It closed July 31 at 200.75 dollars, up 7.8 percent for 2026, after an all time closing high of 235.47 in mid May and a violent late July air pocket: roughly 1,300 billion dollars came off the top twenty chip capitalisations between July 24 and 29, NVIDIA alone accounting for 238 billion, before Microsoft and Amazon cloud results turned the tape around on the 31st [4]. Profits sprinting, price walking: that gap is this dossier's subject.
What the FY26 accounts already established
The EPTA5 base is refreshed once a year by design; its current vintage covers NVIDIA's fiscal 2026, closed at the end of January, and its valuation is dated November 14, 2025, which the terminal prints in so many words under the Valuation block. Three facts stand. Scale: revenue went from 26.97 billion in fiscal 2023 to 216 billion in fiscal 2026, a factor of eight in four years, with 120 billion of net income. Structure: research intensity fell from 27.2 percent of revenue at the end of 2022 to 8.25 percent, not through austerity, the budget more than doubled, but because the denominator changed scale. Cash: 66.5 billion of free cash flow over nine months, buybacks outrunning dividends fifty to one, and a balance sheet that flipped from four times more debt than cash in 2022 to more cash than debt.
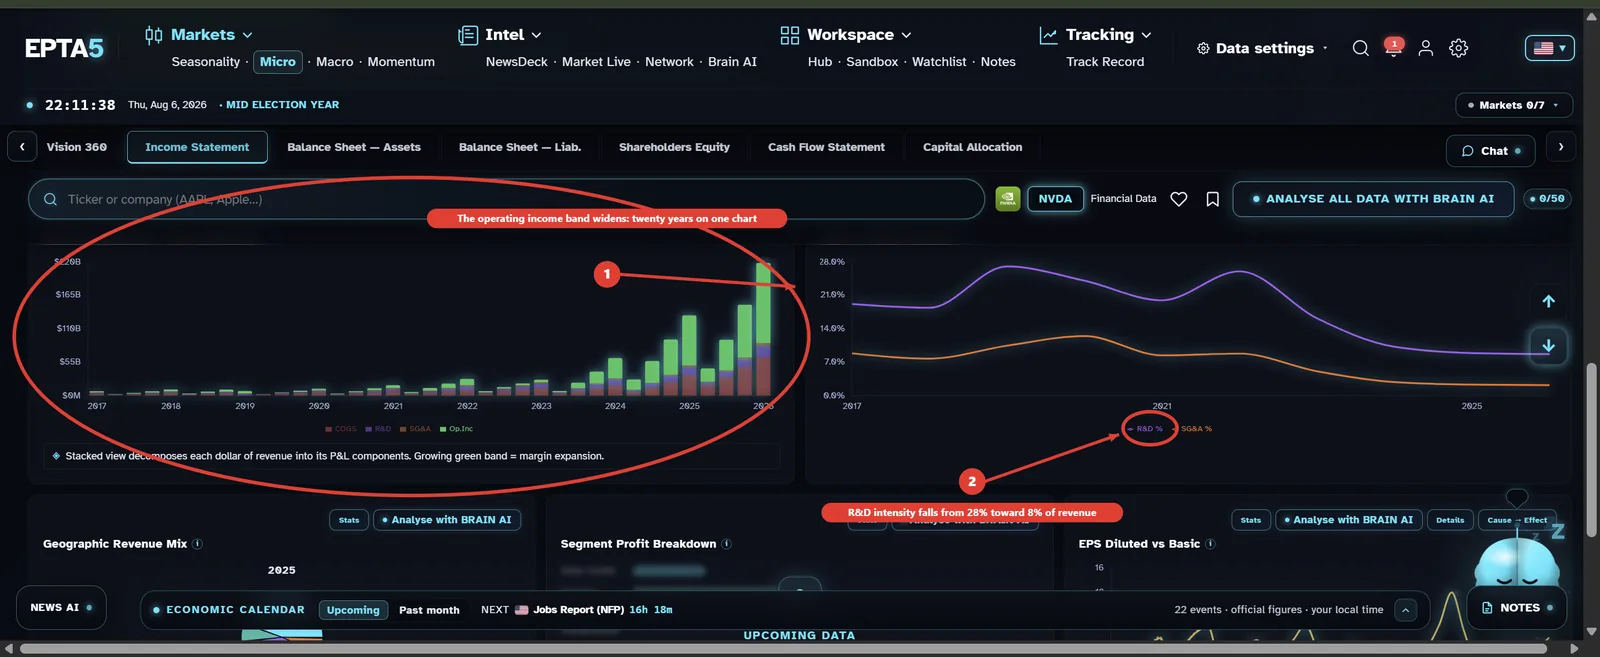
The multiple did the work
First the reconciliation that anchors this series: the FY26 aggregates displayed by the terminal recompose exactly from the quarterly accounts stored in the base, and the geographic split on screen matches the table we query. The data holds, so it can serve as a fixed point. On November 14, 2025, the terminal's vintage date, the share stood at 190.17 dollars and the screen showed 38.8 times fiscal 2026 earnings of 4.90 dollars per share. On July 31, 2026, at 200.75, the same earnings put the multiple at 41 times; slide the window to include the May quarter and trailing earnings reach about 6.52 dollars, for a multiple near 30.8 times. The price moved 5.6 percent in eight and a half months while the current quarter grew 85 percent: 2026 has been the year the market digested the valuation it granted in 2025.
| Date | Price | Earnings base | Multiple |
|---|---|---|---|
| Nov 14, 2025 (terminal vintage) | $190.17 | FY26 diluted EPS, $4.90 | 38.8x |
| Jul 31, 2026 | $200.75 | FY26 diluted EPS, $4.90 | 41.0x |
| Jul 31, 2026 | $200.75 | Trailing incl. Q1 FY27, $6.52 | 30.8x |
Five dates, one reading
- Jan 13
BIS rewrites the China regime: case by case licences up to H200 class, mandatory US third-party testing, a 25 percent duty at import for testing.
The terminal vintage prices the stakes: about a quarter of revenue attributed to China and Taiwan in 2025.
- May 20
Q1 FY27: 81.6 billion, up 85 percent, guidance of 91 billion with zero China compute assumed.
FY26 in the base already showed 216 billion at 60 percent operating margin: the deceleration was priced, the level was not in question.
- Jul 27 to 29
Roughly 1,300 billion dollars comes off the top twenty chip names; NVIDIA loses 238 billion of capitalisation.
Concentration in the base explains the beta: data centres are 88 percent of revenue, Asia-Pacific 42 percent.
- Jul 31
Close at 200.75, up 7.8 percent for the year, after Microsoft and Amazon cloud results.
Against the November vintage at 190.17, the price added 5.6 percent while quarterly profits added 85.
- Aug 26
Q2 FY27 results, announced by the company.
The next reconciliation point between the 91 billion guidance and the accounts.
Left of each pair: the event, verified at the source. Below it: what the EPTA5 base, FY26 vintage, already contained.
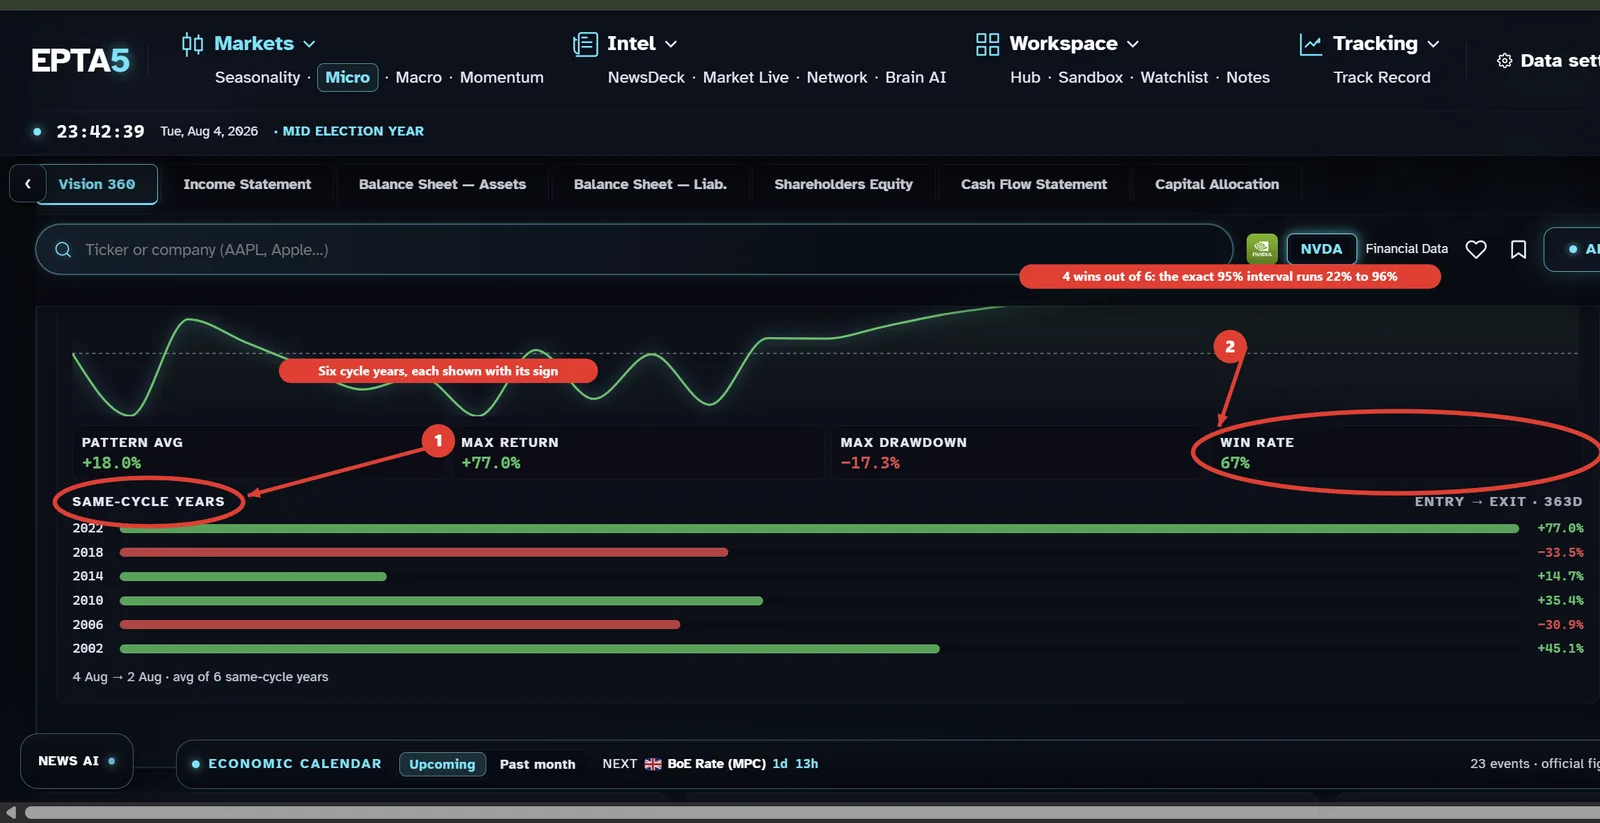
Three numbers were excluded from this dossier. The seasonal pattern above, six observations being a dispersion, not an expectancy. Any multi-year price performance computed on the base's raw history, which is not adjusted for the 2021 and 2024 stock splits. And an aggregator's 1.98 dollar consensus figure for the May quarter, contradicted by the SEC release and the LSEG consensus, discarded along with aggregator sourcing in general.
Sources
- [1] NVIDIA Corp., first quarter fiscal 2027 results, Exhibit 99.1 to Form 8-K, May 20, 2026. sec.gov
- [2] NVIDIA Newsroom, financial results for the first quarter of fiscal 2027, May 20, 2026, and conference call notice for the August 26, 2026 second quarter results. nvidianews.nvidia.com
- [3] CNBC, Nvidia earnings takeaways, May 20, 2026. cnbc.com
- [4] CNBC, chip stocks shed more than one trillion dollars as selloff hits companies powering the AI boom, analysis on FactSet data, July 29, 2026. cnbc.com
- [5] US Department of Commerce, Bureau of Industry and Security, revision to the licence review policy for advanced computing commodities, final rule of January 13, 2026, and the associated presidential proclamation; NVIDIA Form 10-K, fiscal 2026, SEC EDGAR.
- [6] Consolidated session data: July 31, 2026 close at 200.75 dollars, December 31, 2025 close at 186.27, 52 week range 164.07 to 236.54, record close 235.47 on May 14, 2026.
Method. Internal data: EPTA5 base, quarterly accounts deduplicated by security and reporting date before any computation; FY26 aggregates reconciled against the stored quarters. Terminal captures made live on the production terminal during the analysis, annotated at reading time, and dated in each caption. Every external fact was verified on a primary source (SEC, BIS, company releases) or on session data, then submitted to an independent adversarial re-check; aggregators and content farms are excluded from sourcing. The multiples table is an internal computation with its method stated.
Disclaimer. This article is published for educational and informational purposes only. It does not constitute investment advice within the meaning of MiFID II, nor an investment recommendation within the meaning of Regulation (EU) 596/2014, nor an inducement to buy or sell any financial instrument. Nothing here accounts for the situation, objectives or horizon of any particular reader. Past performance is not a reliable indicator of future performance. EPTA5 INC. is a data and software platform; we provide tools and historical series, not portfolio management.
Discussion(0)